Sales analytics
Price/volume/mix decomposition, customer cohort behavior, pipeline conversion funnels, win/loss patterns. Surfaces revenue leakage and customer opportunities the sales team can act on immediately.

Render Analytics builds the Data & AI Analytics that turn scattered financial and operational data into clear answers for leadership. Our platform sits on a governed data foundation, a single source of truth, with three surfaces on top: dashboards and reporting, AI-driven analytics that surface signals for action, and natural-language querying.
Data & AI Analytics done well is more than dashboards. It's a discipline, grounded in how businesses operate and create value. It's a way of choosing what to build, what to ignore, and how to deliver. Four principles guide every Render engagement, forming a single arc.
Every engagement ties to value in two ways: moving an Enterprise Value driver (Sales Growth, Margin Expansion, or Working Capital Efficiency), or reclaiming the team's time by automating manual reporting, so hours go to decisions instead of downloading data and building spreadsheets.
Analytics is only as good as the data beneath it. Render builds the governed data foundation first, audited, built, and kept healthy, so everything above it can be trusted.
We deliver KPIs and actionable insights to decision-makers, not just data and proliferating reports. The discipline is choosing what's worth surfacing, and what's just noise dressed up as information.
Analysis earns its keep when it moves the business. Whether it's automated financials, a live KPI dashboard, or a strategic review, every deliverable is built to be used, clear enough to read at a glance and act on to increase Enterprise Value.
Middle market companies have similar constraints. They have different systems but the same gaps between the data the business generates and the decisions leadership needs to make. Private equity owners expect timely and data-driven decisions, yet after close, most companies are not prepared.
Data lives across many systems without a single source of truth.
FragmentationReports show last month. Decisions are real time.
LatencyAnalysis is done manually by the people who can least afford the time.
Manual liftAntiquated systems and data gaps hide business performance.
Blind spotsThe strategy is clear. The signals to act on it are missing.
Signal gapThe asset everything else depends on. A clean, modeled, queryable single source of truth, structured by a semantic layer, governed by business logic, and monitored for quality. Every change is versioned and reviewed, so no one edits the data directly and every number traces back to a definition. Render builds and maintains it; every surface above runs on it.
Understand the systems of record, where data lives, and what's missing. The output is a prioritized roadmap for building the data models, and for identifying process improvements to capture data that may be missing.
Build the data warehouse, the semantic layer, and the business logic, versioned and governed so every number traces back to a single definition. The result is a well-structured, purpose-built foundation serving analytics and automated reporting, designed to facilitate timely business decisions.
We update the data foundation as the business needs change. New systems get integrated, logic evolves, and automated checks re-verify known-correct numbers every cycle. The foundation is a living asset and Render keeps it healthy.
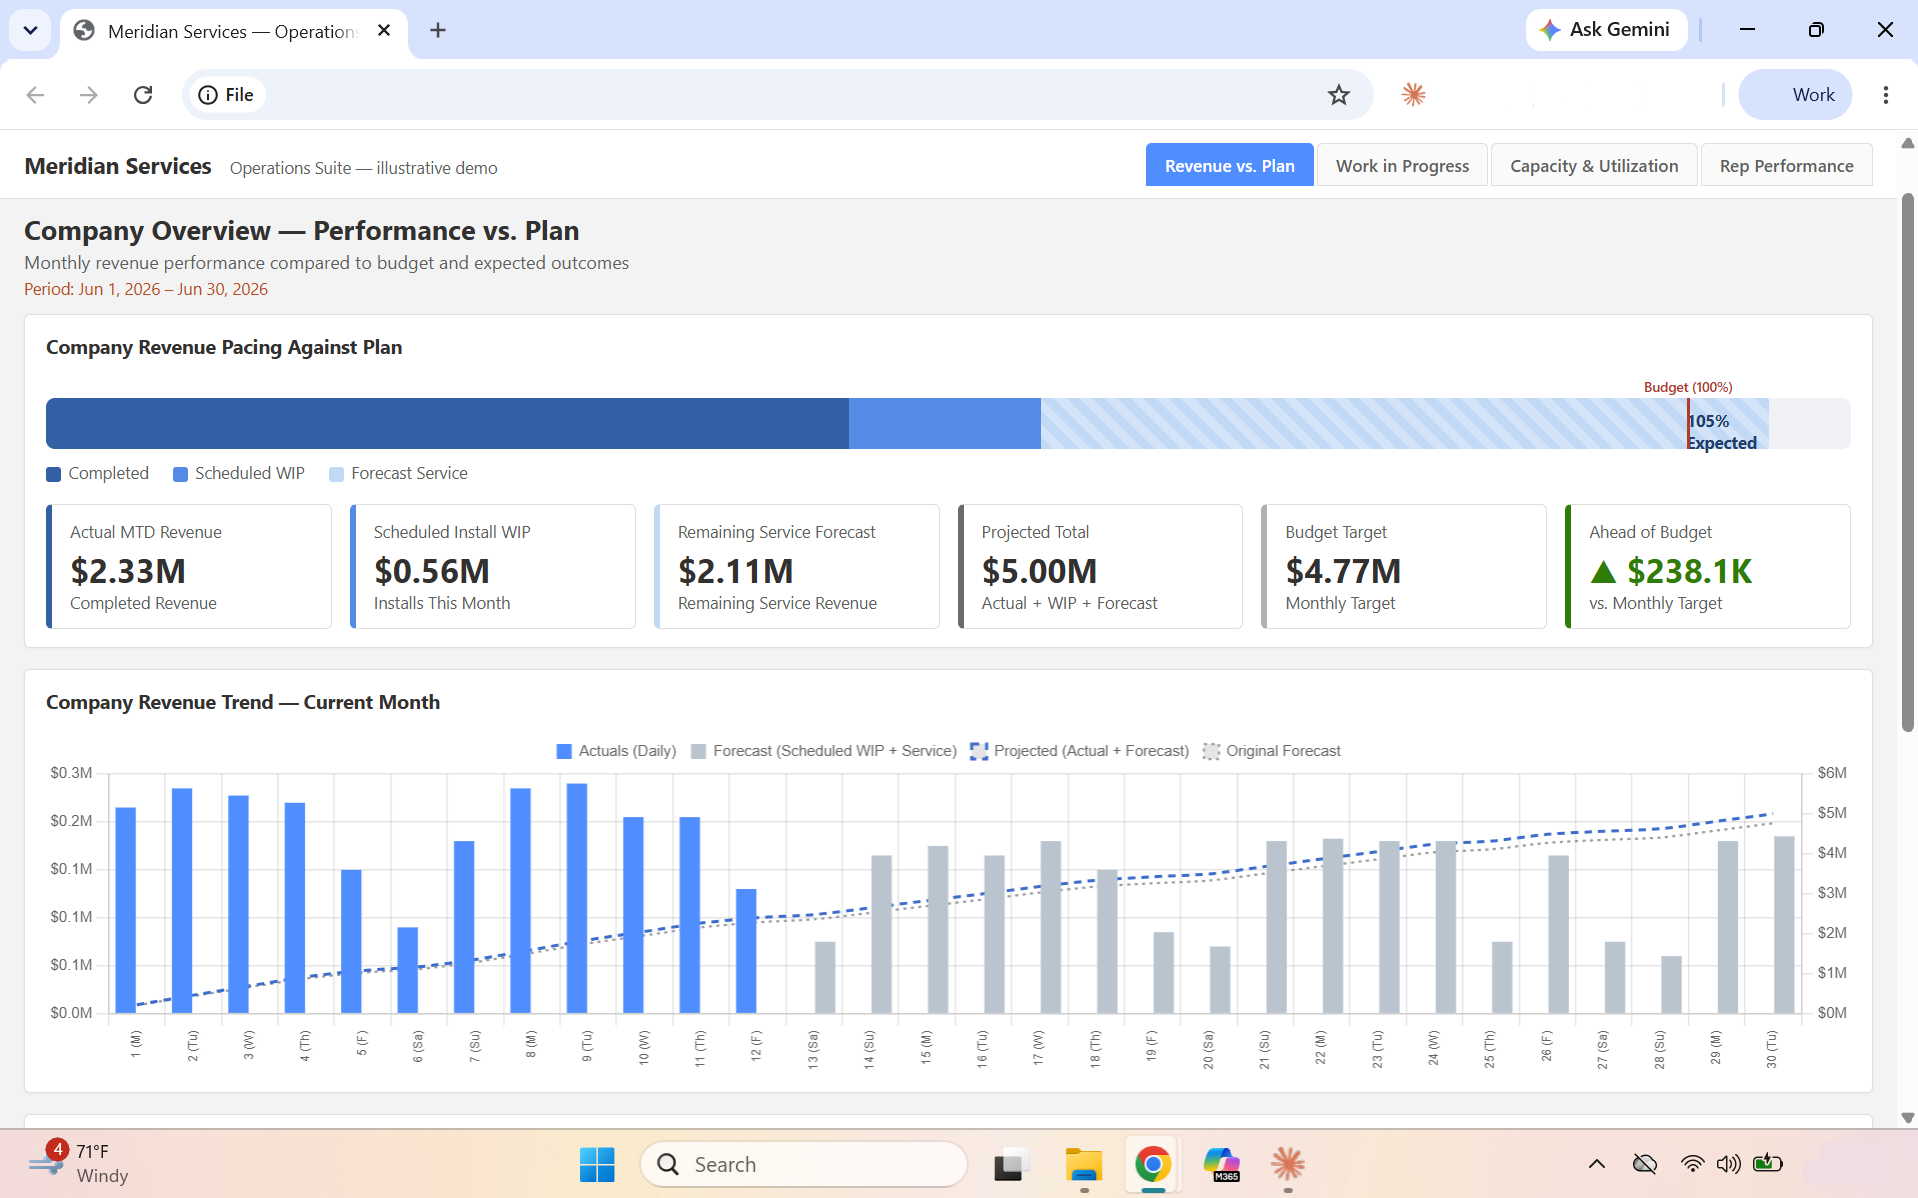
The always-on layer, aggregating data from multiple systems of record into one analytics platform. Built for the people who use the data daily: sales teams chasing monthly targets, finance teams running variance analyses, plant managers watching throughput. Delivered in Power BI and Claude, with fresh data.
Render builds automated financial statement packages and AI-driven financial analysis, so that the CFO is always ready for monthly management and quarterly Board meetings. We also deliver consolidated financials across multiple accounting systems: one reporting standard, no manual roll-ups.
KPI dashboards for the C-Suite who need to keep a real-time pulse on business performance. Driver-anchored, kept fresh. The view leadership scans first thing Monday morning.
Site, region, SKU, customer-level views for the people running the business day-to-day. Each one ties to actual operating decisions and supports the strategic reviews. Reliable data used by teams to improve performance.
Render's AI-Driven Analytics runs on governed semantic models and real business context, so it surfaces targeted signals aligned to leadership's strategic goals and tied directly to value-creation initiatives. Deep dive reports that deliver meaningful insights. Monitoring agents that surface changing performance. AI-driven workflows that mirror the activities of seasoned business analysts. All delivered to your inbox.
AI is only as good as what it understands. A strong semantic layer and real organizational context are what turn a generic model into a true enterprise AI application, moving it out of a desktop folder of one-off prompts.
Managed agents run the analytic work on a schedule, pulling the data, finding the signal, and producing updated reports targeted on identified strategic initiatives.
Reports land in the inbox of the Management team. Built-in feedback loops track what got executed, and whether results are moving business performance forward.
The self-service layer. Operators ask questions in plain language and build their own charts against the governed models. No SQL, no waiting on an analyst. Every answer runs on the same business logic the dashboards and reviews use, so the numbers stay consistent.
Use natural language to query your data. No need to wait on responses to your emails or chat messages. The answer comes back in seconds.
Follow the thread, chart it, drill in. Explore business performance yourself and create your own reports.
Every answer runs on the same governed definitions behind the dashboards and reviews, so two people asking the same question get the same number. Right inside the AI platform you already use.
Render uses technology and applications from Google, Anthropic, Microsoft, and other well-established platforms for enterprise data science and analytics. A consistent data engine but AI-agnostic to provide flexibility with what analytic tools are best over time.




Below are examples of where Render's work shows up in client engagements. Each anchored to the driver it moves.
Price/volume/mix decomposition, customer cohort behavior, pipeline conversion funnels, win/loss patterns. Surfaces revenue leakage and customer opportunities the sales team can act on immediately.
Productivity by site, shift, and role. Overtime patterns. Surfaces where labor cost is moving the wrong way and where capacity is sitting idle.
Capacity utilization, throughput, and OEE by line and shift. Scrap rates and first-pass yield, unit cost trends, and downtime drivers. See where output is constrained and where margin is leaking on the floor, in time to act on it.
Marketing CAC by channel, G&A leakage, software-stack consolidation. Surfaces where opex is growing faster than revenue, and which lines are the easiest to compress.
AR aging behavior, DSO compression, detailed inventory analytics and supply chain management, cash conversion cycle tracking. Releases trapped capital the business can redeploy.
Automated month-end reporting, variance commentary generation, board-ready P&L roll-ups. Closes the gap between data and decision so leadership has information immediately after close.
Tell us what's on your plate. We'll help you make sense of it.
